1
Count
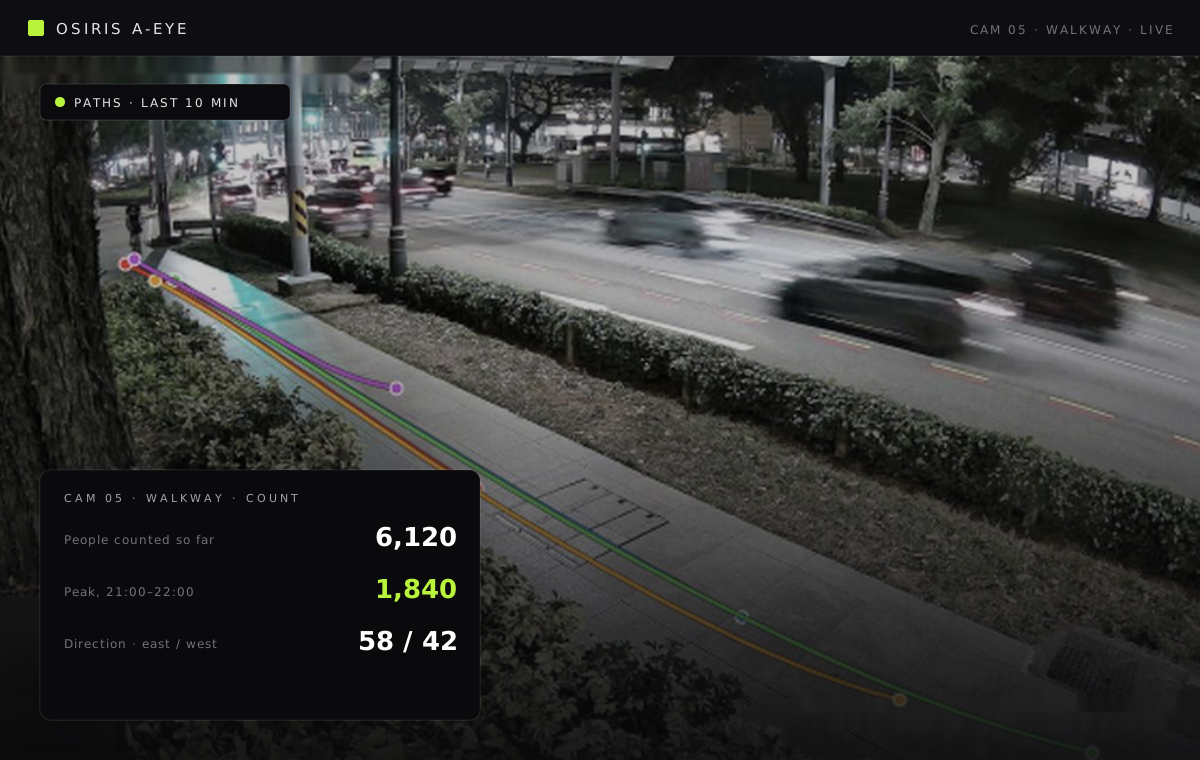
Every person crossing the walkway is counted by direction and by hour, and their paths are drawn over the camera view, so the peak and the route are both visible.
Computer vision on the cameras you already own. Who passed, who stopped, how long they stayed and where they went next, and on sites, who is missing a helmet or standing where they should not be.
Overview
A-EYE connects to the CCTV and IP cameras a place already has and runs our vision models on the feed. Instead of a wall of footage nobody watches, the cameras produce numbers: how many people crossed a space, how many stopped and for how long, which way they went, and how all of that changed by hour, by day and by what was happening at the time.
Its largest deployment to date measured a multi-venue night festival for a national heritage agency. Across three sites it counted plaza traffic, measured how many visitors stopped at an artwork and for how long, followed the share who went on to enter the museum, tracked how attention rose and fell with the projection schedule, and trialled aggregate smile detection at entry and exit as an experience indicator. The findings went into the client’s management meeting as recommendations on programming, staffing and precinct design.
The same engine runs in safety mode on construction sites and in laboratories: helmets, vests and gloves, or lab coats, covered shoes and goggles, checked on every person in frame, with restricted-zone alerts and optional face recognition for access. By default A-EYE counts and evaluates people without identifying anyone, and nothing it stores can be traced back to an individual.
Features
Count people crossing a plaza, a walkway or a door, by direction and by hour, and follow what share of them went on to the next space.
How long people stayed, how many stopped for more than 20, 40 or 60 seconds, and how many were actually watching rather than passing through.
Where people walked, where they lingered and which routes they never took, drawn over the camera view for every period you choose.
Peak windows by day and time, so staffing, crowd management and programme timings follow the pattern instead of guessing at it.
Aggregate smile detection at entry and exit as an experience indicator, reported as patterns across a crowd, never per person. Offered as a validated pilot.
Flags missing helmets, vests and gloves on site, or lab coats, covered shoes and goggles in the lab, on every person in frame.
Draw restricted zones on the camera view. Anyone who should not be there triggers an alert with a snapshot. Enrol staff for touchless access where you need it.
Telegram or the dashboard, within a second, with the frame attached. Every event is kept, so an audit is a filter and an export.
Findings and recommendations written up per venue and per period, in the format the client presents upward, not a raw data dump.
One evening, measured
Three views from the same festival cameras. Identifying details are masked and the numbers are illustrative.
Every person crossing the walkway is counted by direction and by hour, and their paths are drawn over the camera view, so the peak and the route are both visible.
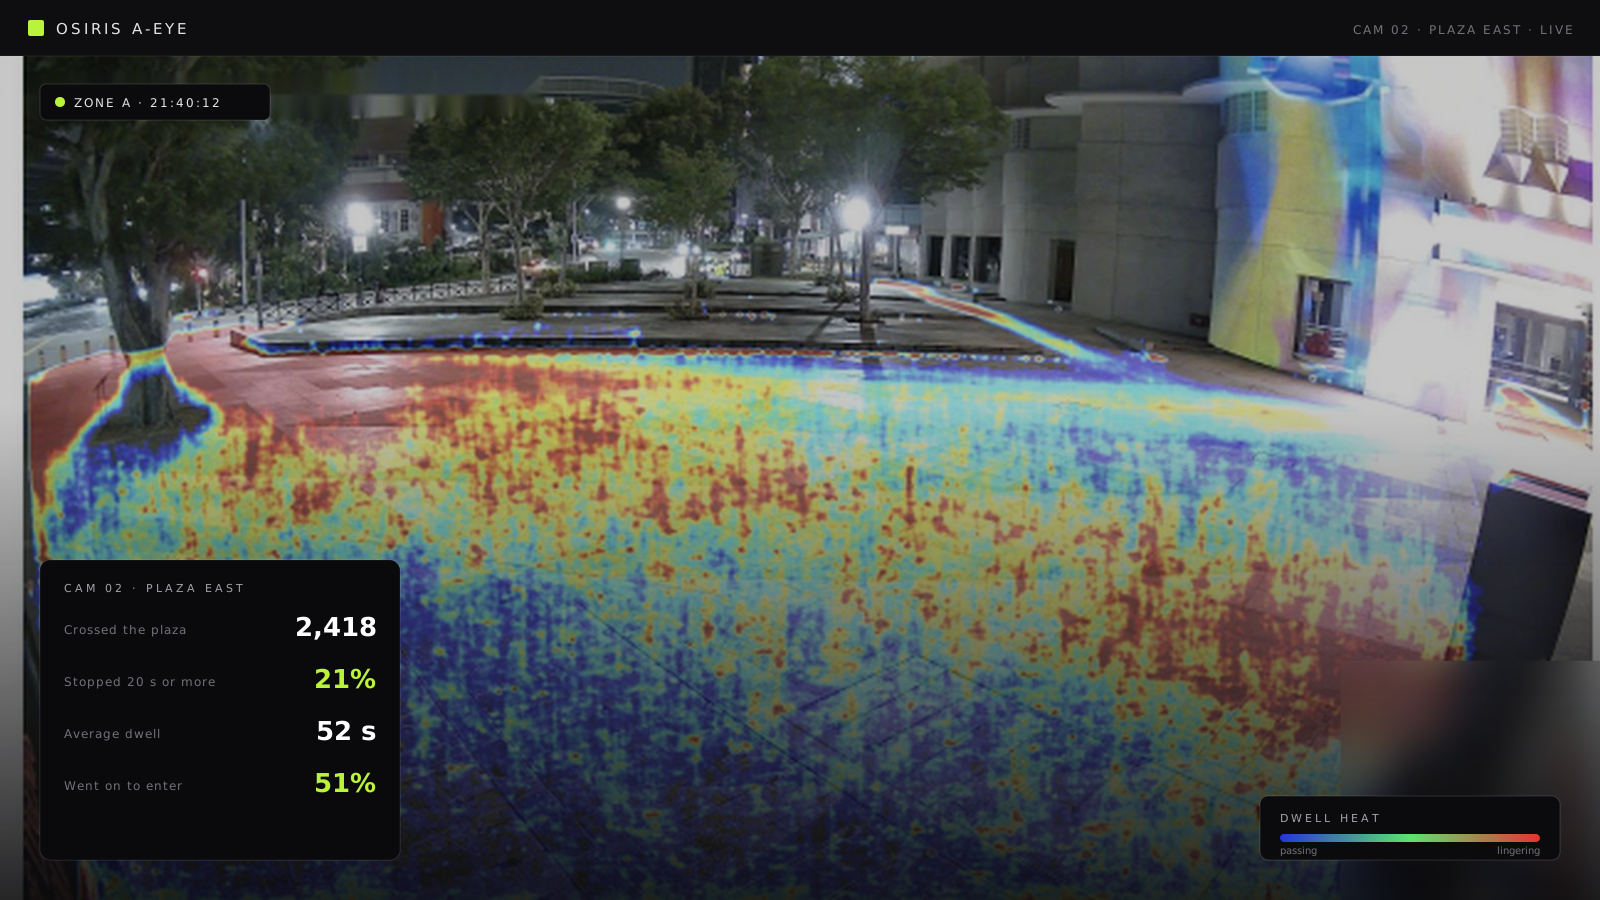
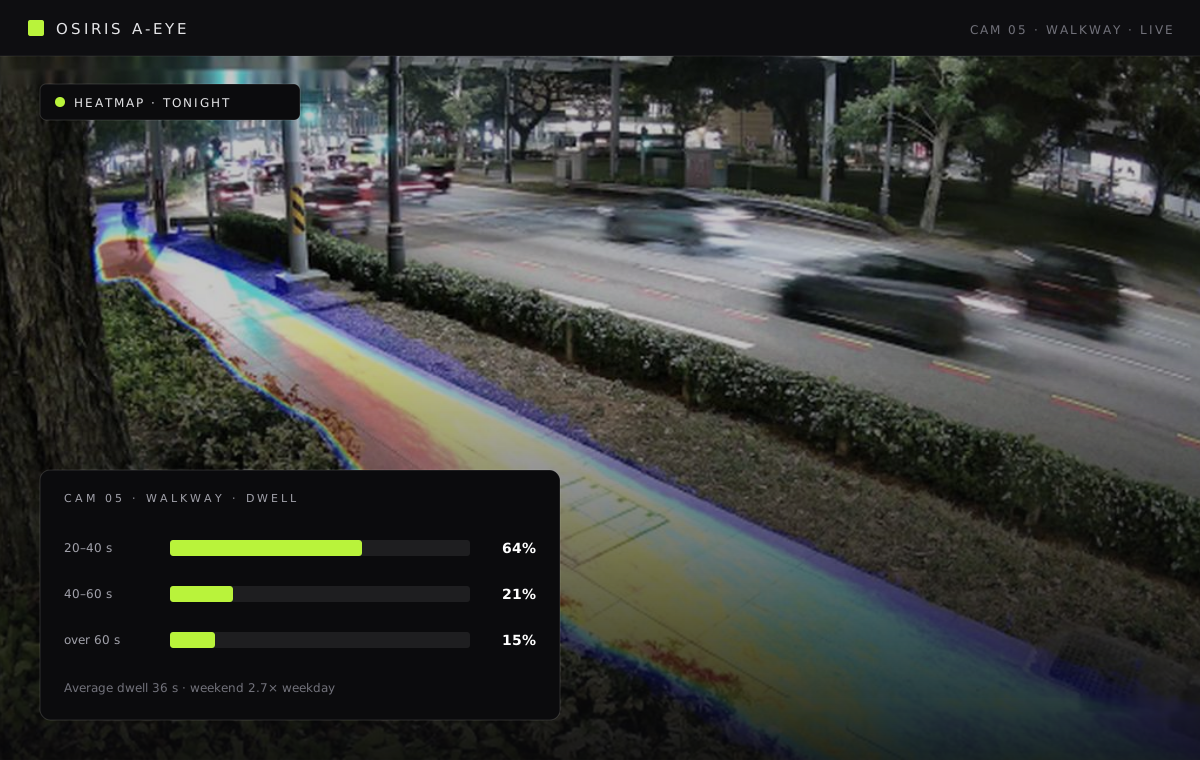
A heatmap shows where people lingered and a dwell breakdown shows how many stayed past 20, 40 or 60 seconds, by weekday and weekend.
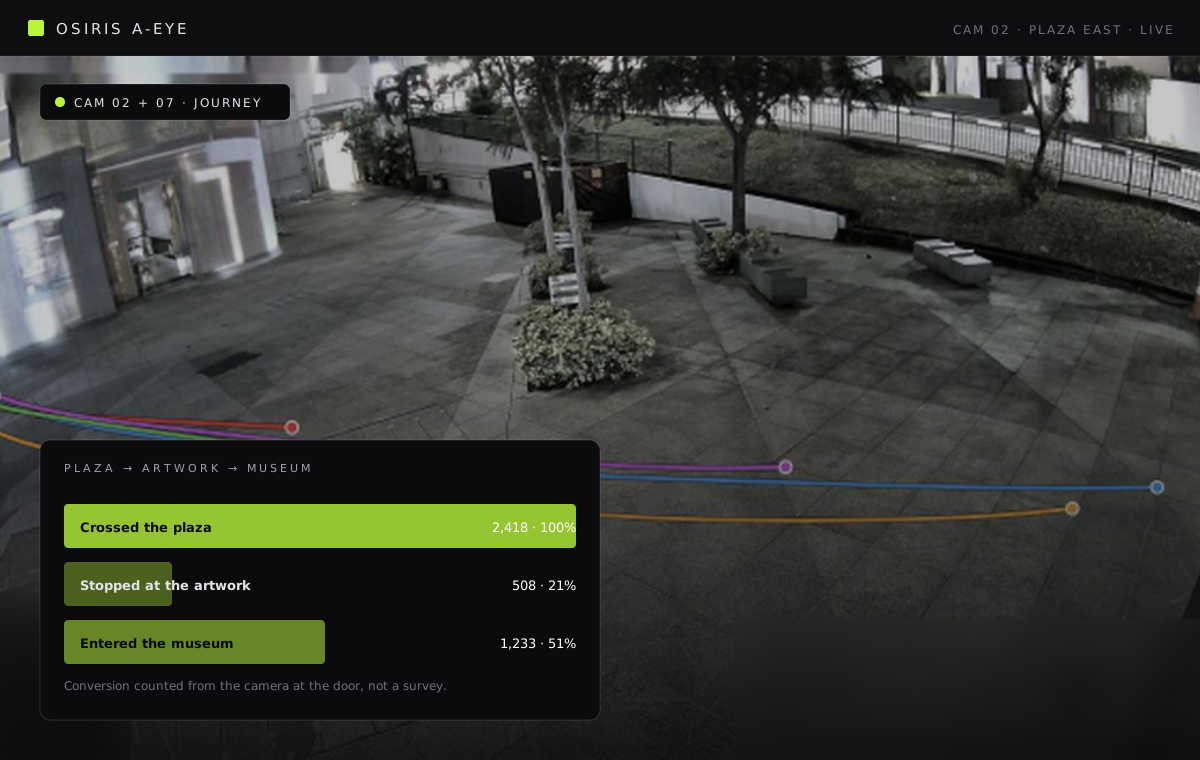
Cameras at the plaza, the artwork and the museum door are joined into one journey, so the share who crossed, stopped and went inside is a measured funnel.
How it works
Point A-EYE at your existing CCTV streams. An edge device on site keeps video local.
Draw the zones, lines and journeys that matter, or the restricted areas and PPE policy for a site. No faces need enrolling.
Counts, dwell, paths and conversion by period on the dashboard, alerts in real time, and a written report when there is a meeting to take it to.
We will walk through it on a call, with your site and your numbers, and tell you honestly whether it fits.